
Website Speed Audit: How to Test, Understanding Core Web Vitals, and Top Optimization Fixes
A comprehensive guide to testing site speed with PageSpeed Insights: understanding LCP, INP, and CLS thresholds, field data vs. lab data, and the top 10 performance fixes for Israeli business websites.
A website speed audit is the fundamental technical assessment every business owner should conduct before investing in SEO, redesigns, or digital ad campaigns. A slow website bleeds mobile visitors, degrades Google user experience scores, and increases cost-per-click in paid marketing. However, many business owners run an audit, see an alarming red score, and have no actionable roadmap to resolve it. This guide breaks down how to run a rigorous PageSpeed Insights audit, the critical distinction between field data and lab simulation, what Google's Core Web Vitals thresholds represent in plain terms, and the 10 highest-impact performance fixes for Israeli business websites.
How to Conduct a Website Speed Audit in PageSpeed Insights
Google's free diagnostic tool, PageSpeed Insights, is the definitive industry starting point. While other auditing tools exist, PageSpeed Insights is the only platform that reveals the actual performance metrics Google uses in its ranking algorithms. Follow these four methodical steps:
- Audit Specific Page URLs rather than just your root domain. Your homepage, high-traffic service pages, and active advertising landing pages possess distinct asset payloads and yield different speed scores.
- Analyze the Mobile Tab First. The overwhelming majority of Israeli consumers browse on mobile devices. Google operates on mobile-first indexing and evaluates user experience primarily on mobile viewports. Desktop performance scores are almost always higher and less diagnostic.
- Examine Real-World Field Data (CrUX) Before the Overall Score. At the top of the report, review the Chrome User Experience Report (CrUX) field data representing the 75th percentile of actual real-world visitors over the previous 28 days. This is the dataset Google evaluates for ranking signals.
- Interpret Lab Data (Lighthouse 0–100 Score). The composite 0–100 score is a controlled synthetic simulation conducted on a throttled mid-tier mobile device and 4G connection. It serves as an engineering diagnostic tool rather than a direct ranking grade.
Note: Low-traffic websites may lack sufficient CrUX sample sizes to generate field data summaries. In such instances, rely on lab diagnostics alongside Search Console Core Web Vitals reports. Furthermore, execute audits two or three times consecutively to account for transient server load variances.
Understanding the Metrics: LCP, INP, and CLS Explained Simply
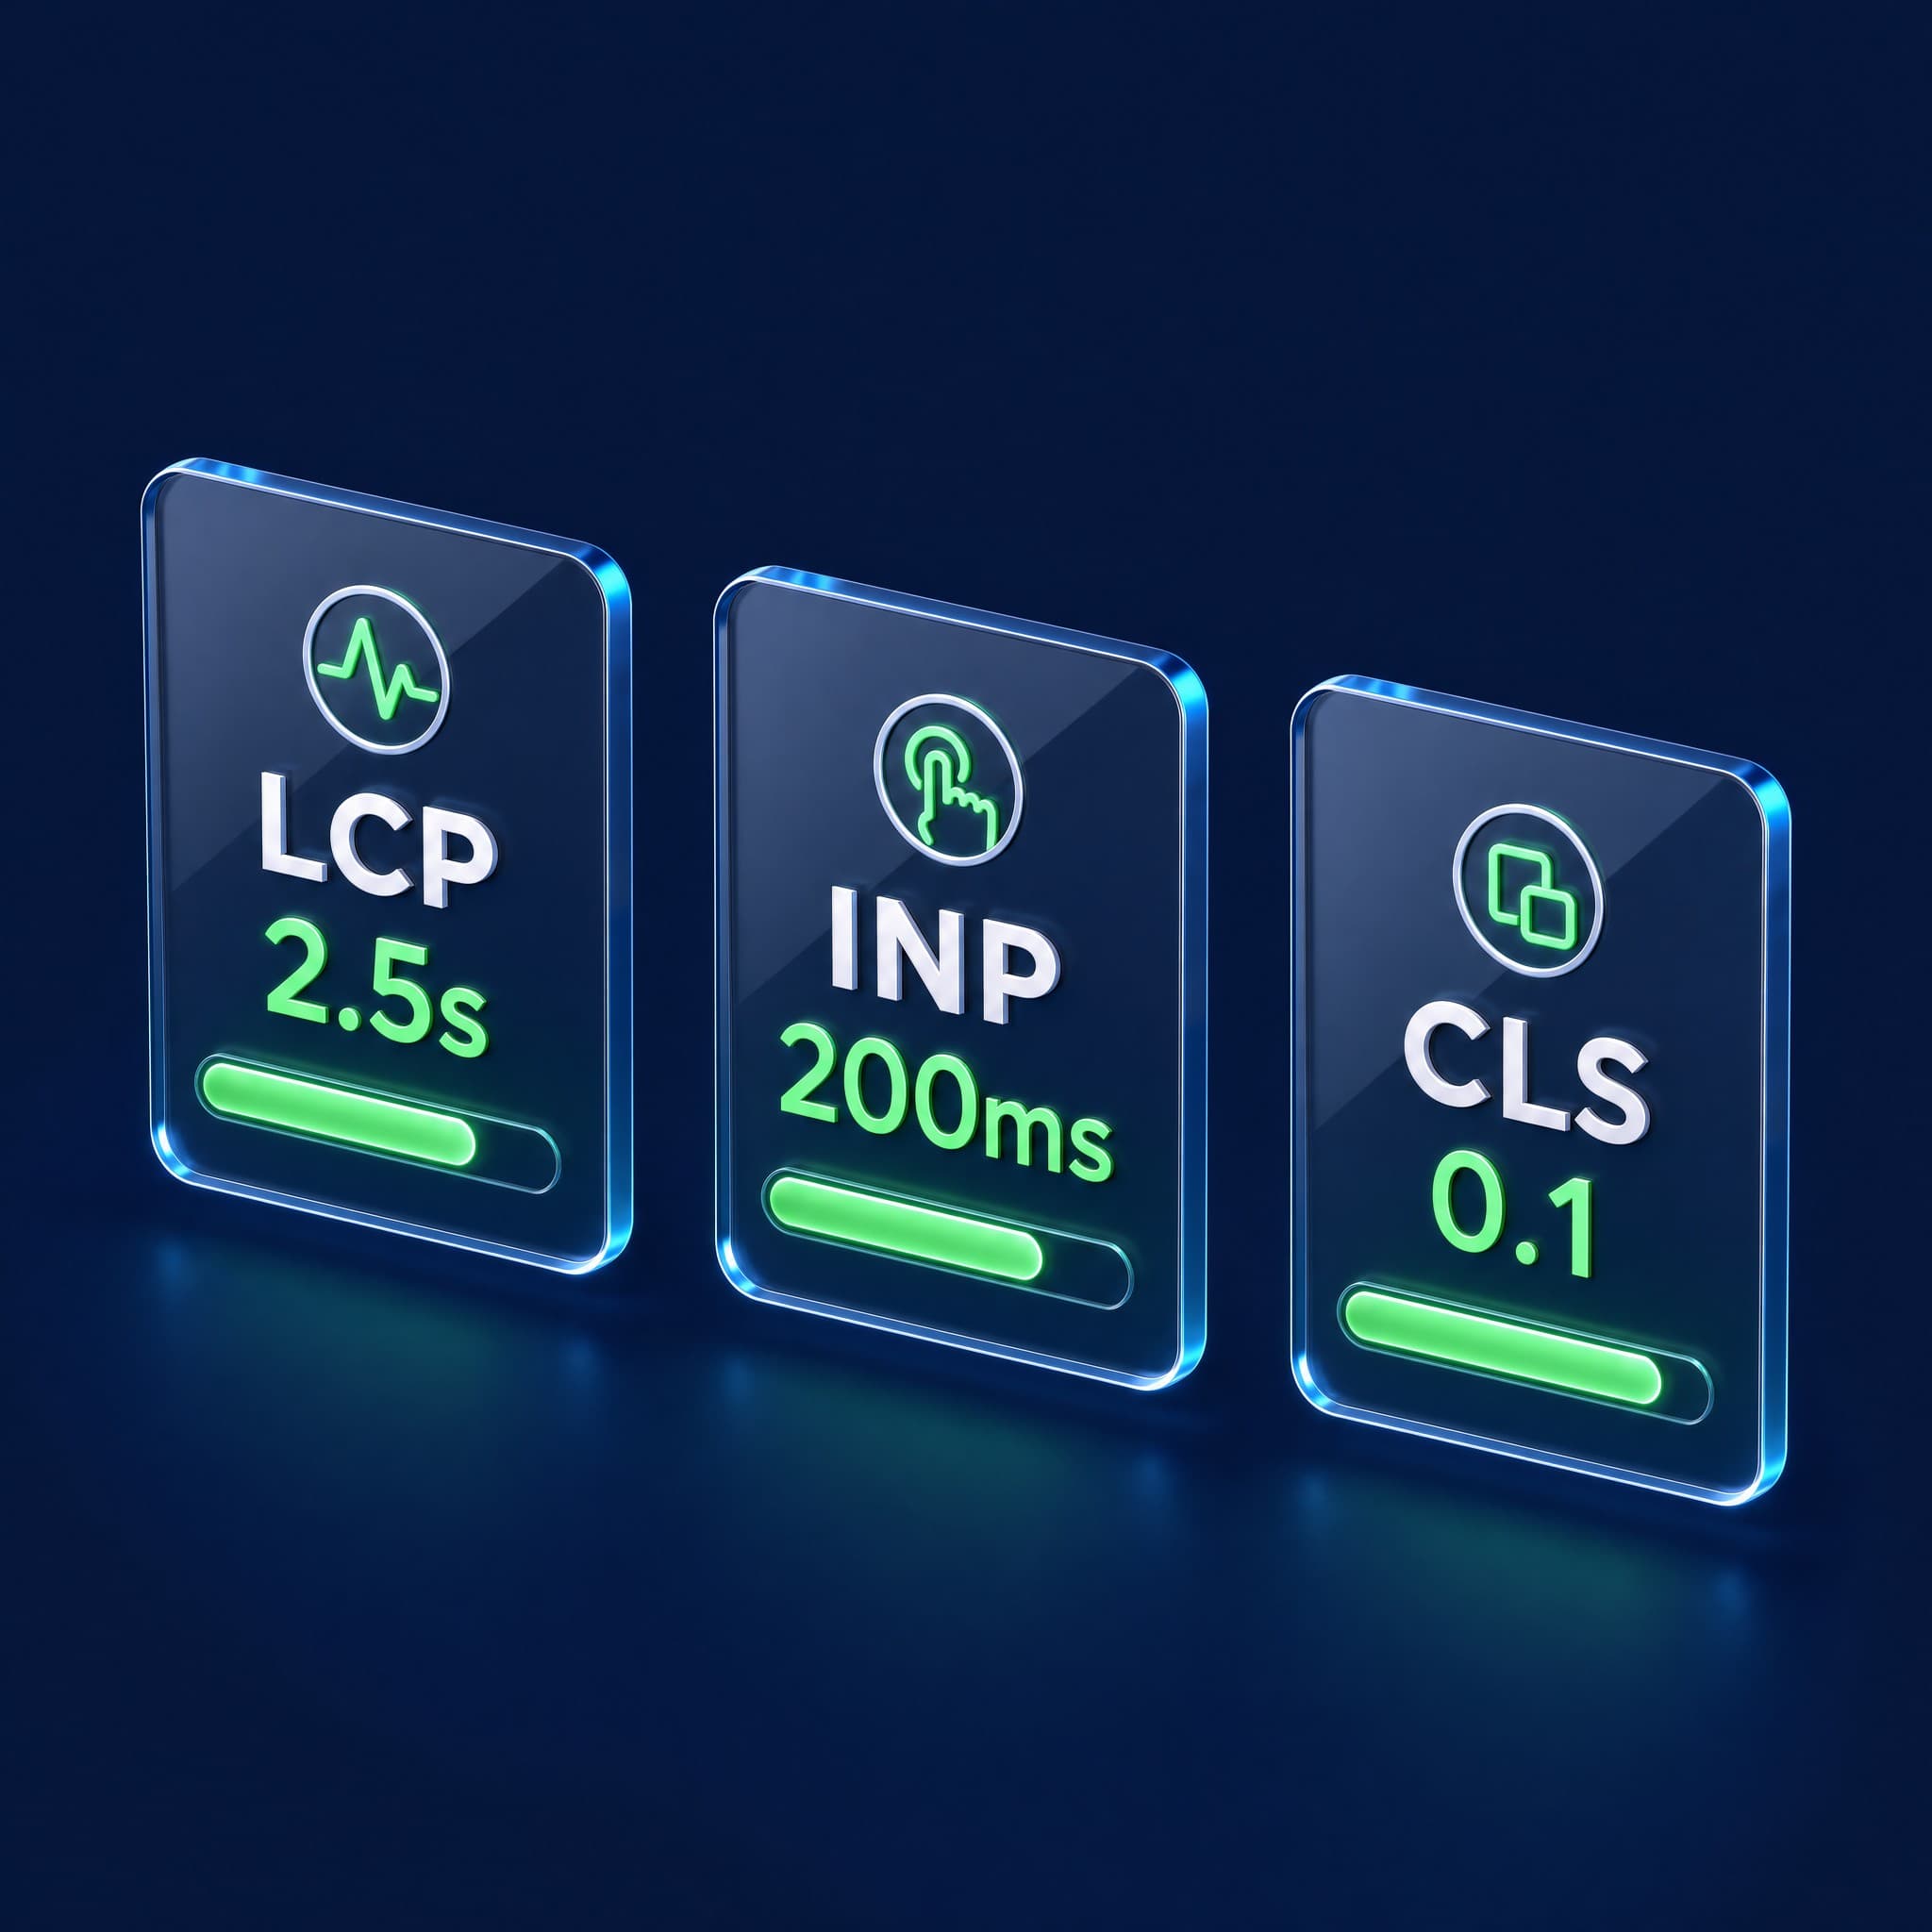
Google synthesizes holistic page loading experience into three primary Core Web Vitals benchmarks. Each metric evaluates real-world user interaction against strict "Good" green thresholds:
LCP (Largest Contentful Paint) – Visual Loading Velocity
LCP measures the time required for the largest visual content element in the initial viewport (typically hero images, banners, or primary heading text blocks) to render completely. The green standard is 2.5 seconds or faster. Durations between 2.5 and 4.0 seconds require improvement, while anything exceeding 4.0 seconds is classified as poor.
INP (Interaction to Next Paint) – UI Responsiveness
INP measures the latency between a user interaction (tapping a mobile hamburger menu, submitting a form, or clicking an accordion) and the resulting visual interface update. The green benchmark is 200 milliseconds or less. Latencies between 200ms and 500ms need remediation, while scores over 500ms create noticeable interface lag. INP permanently superseded FID (First Input Delay) in March 2024.
CLS (Cumulative Layout Shift) – Visual Stability
CLS evaluates layout instability caused by asynchronous asset loading—such as late-rendering banner ads or unconstrained images shifting text blocks just as a user attempts to tap. The green threshold is 0.1 or lower. Scores between 0.1 and 0.25 require optimization, while shifts above 0.25 cause disruptive browsing friction.
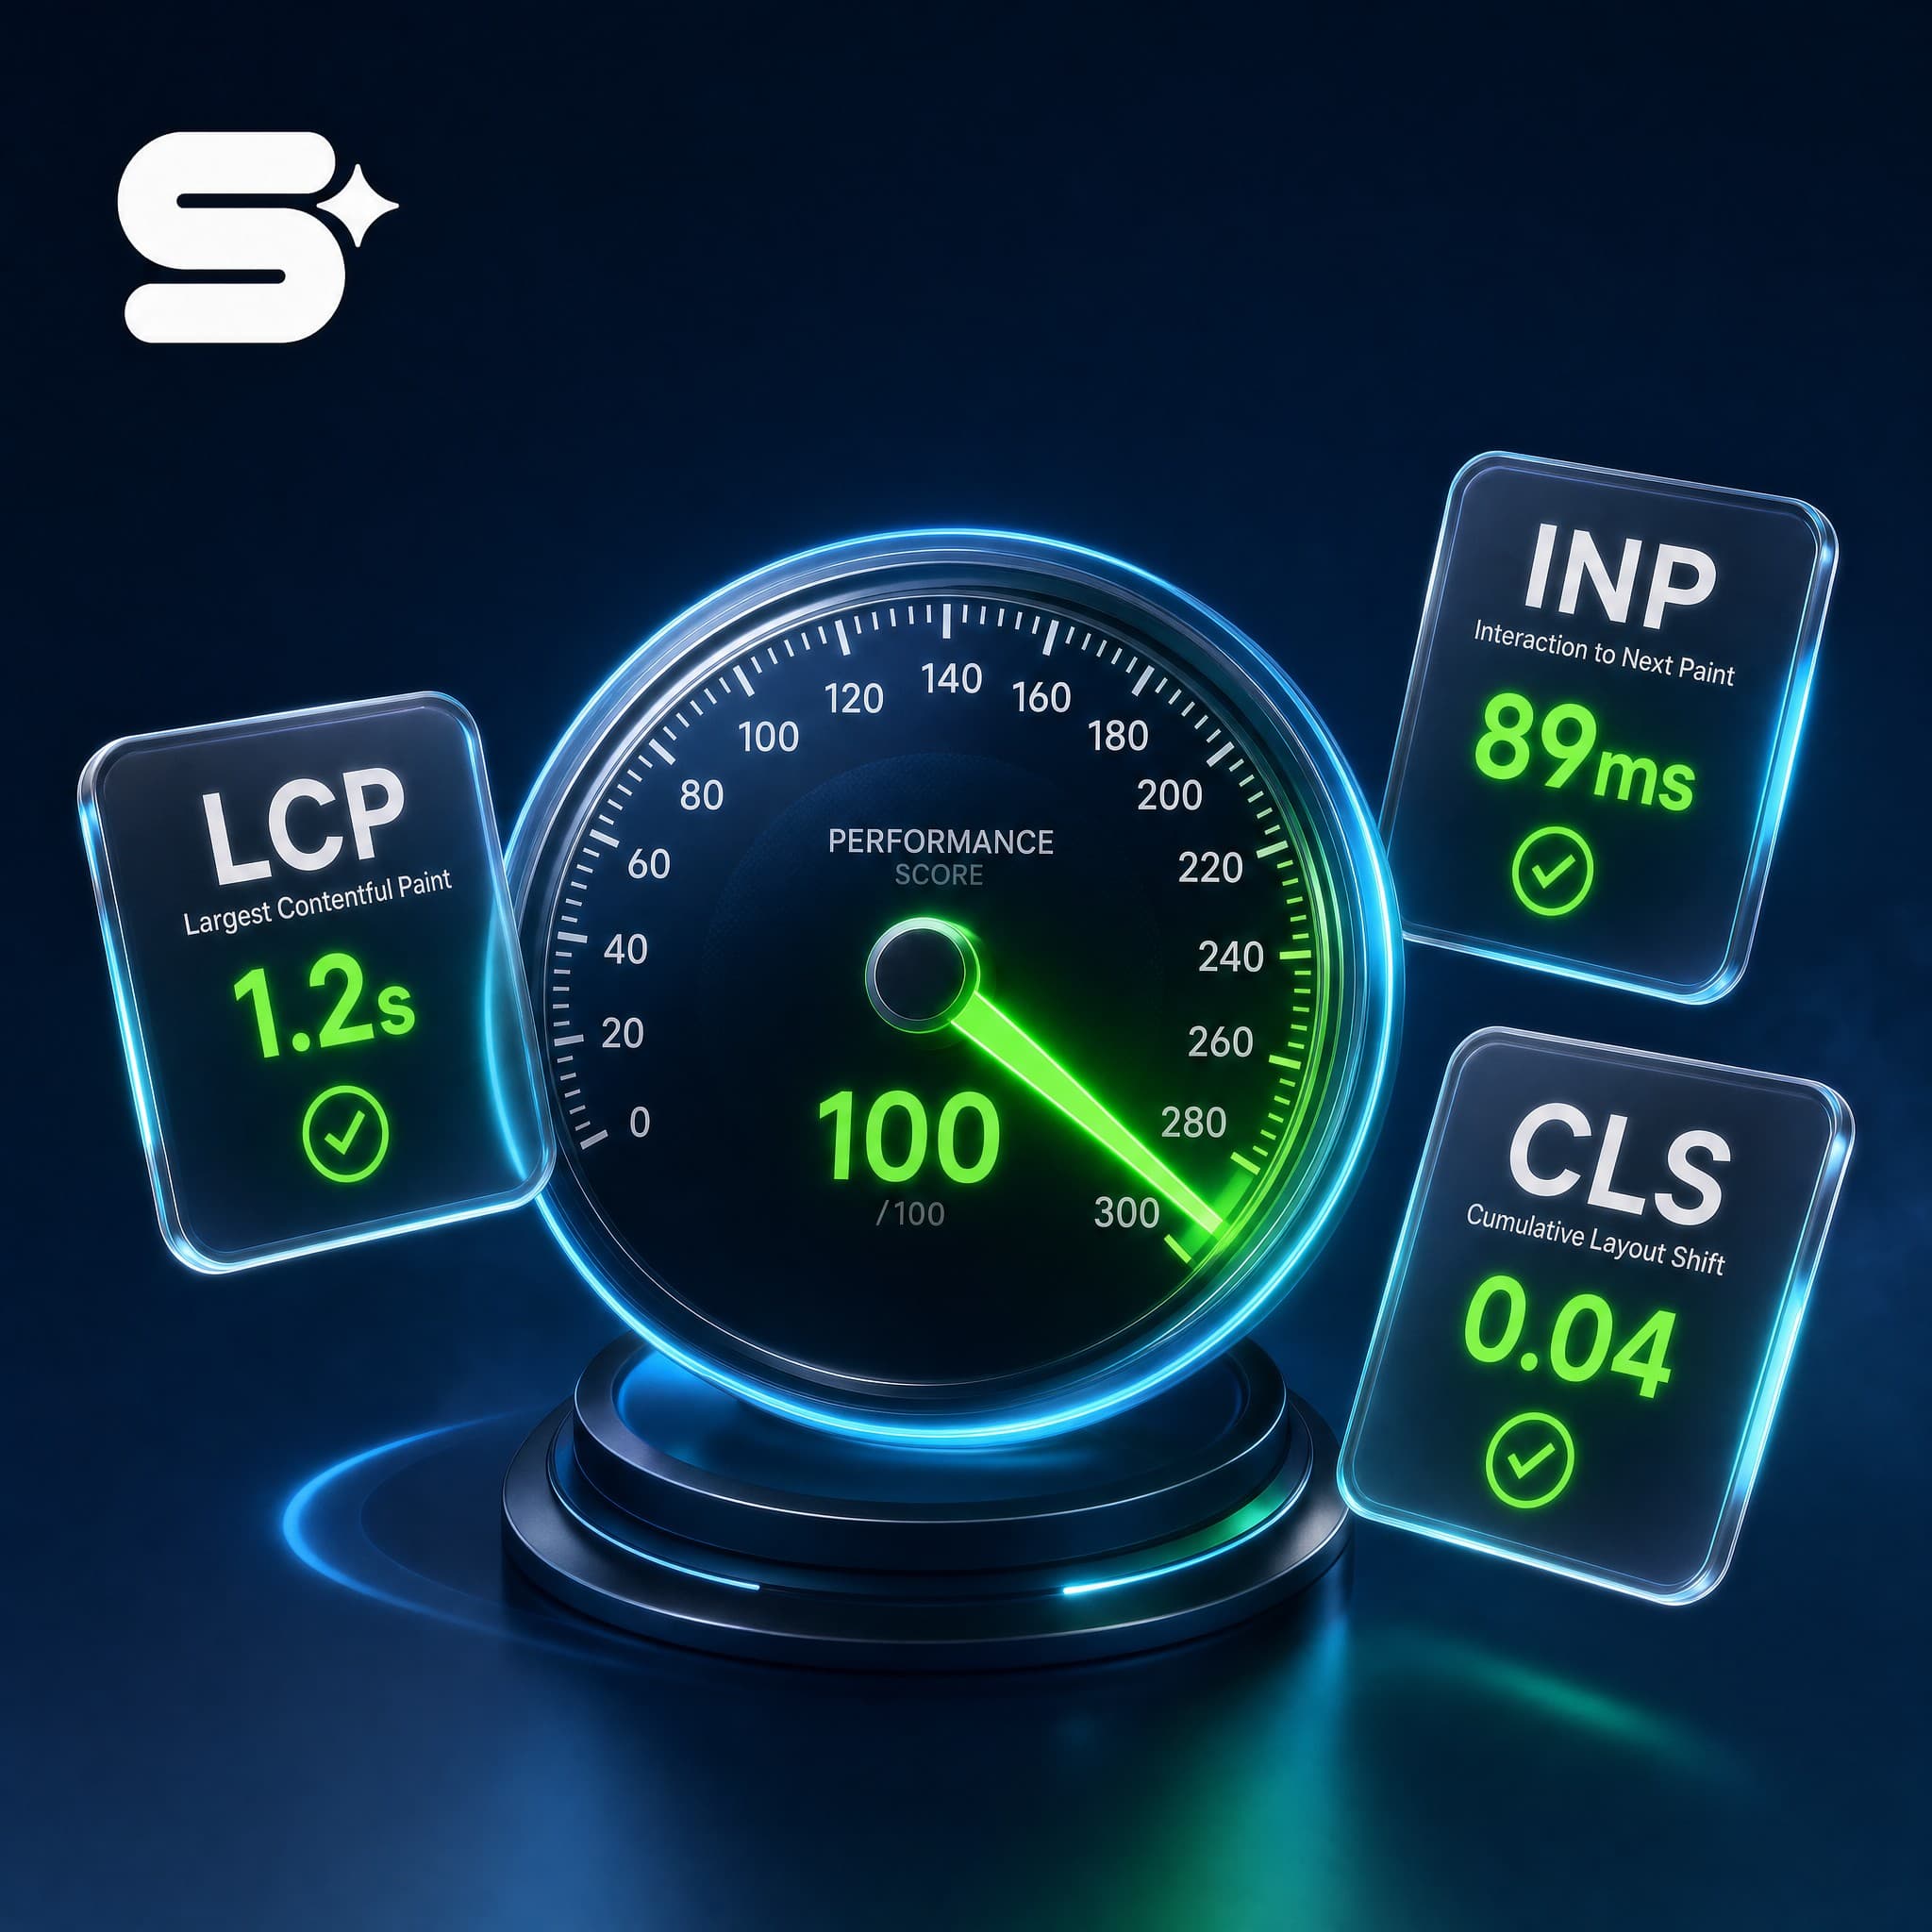
It is entirely possible to achieve a lab score of 60 while passing all three Core Web Vitals in real-world field conditions, and vice versa. When developers guarantee a "100/100 score," demand verification of mobile field data over synthetic lab graphs.
Why Site Speed is a Direct Business Engine, Not Just an SEO Metric
While Core Web Vitals serve as a confirmed Google search ranking factor, they function as a tiebreaker alongside content relevance and domain authority. The immediate, measurable impact of page speed is financial:
- Reduced Mobile Bounce Rates: Paid advertising traffic leaves immediately if hero sections fail to render within 3 seconds, resulting in wasted ad spend.
- Increased Lead Conversion Rates: High INP latency causes perceived interface unresponsiveness, prompting frustrated users to abandon inquiries or trigger accidental duplicate submissions.
- Lower Cost-Per-Click in Google Ads: Google Ads Quality Score factors in landing page user experience. Sluggish landing pages suffer Quality Score penalties, inflating required bids to maintain top ad positions.
Performance optimization frequently represents the highest-ROI investment to scale underperforming ad funnels.
10 Common Site Speed Fixes for Israeli Businesses

What We Observe in the Field
Across engagements with 200+ businesses, our diagnostic sequence remains structured: first, verify mobile 28-day field data; second, analyze server response time (TTFB); third, pinpoint the exact DOM element triggering LCP. Optimizing images is futile if server infrastructure takes 1.5 seconds to deliver the initial byte. The most frequent agency blunder we encounter is presenting desktop 95/100 screenshots while mobile users experience red LCP metrics. At Simple Web, every production website launches with verified green mobile Core Web Vitals.
The following 10 remediation steps consistently yield the greatest performance gains:
- Heavy Image Optimization: Hero images are the primary culprits behind poor LCP. Convert assets to modern WebP or AVIF formats, enforce responsive srcset sizing, and never apply lazy loading to above-the-fold hero elements.
- High-Performance Hosting: When Time to First Byte (TTFB) exceeds 800ms, server architecture bottlenecks all subsequent rendering. Deploy servers physically proximate to Israel or place an enterprise CDN edge proxy in front. For hosting guidance, consult our domain and web hosting guide.
- WordPress Plugin Rationalization: Every active plugin injects additional stylesheets and scripts across site templates. Purge inactive extensions and consolidate redundant utilities.
- Hebrew Web Font Subsetting: Avoid loading multiple redundant Hebrew font weights. Standardize on 2 core weights, apply
font-display: swap, and host typography locally on fast origins. - Third-Party Script Deferral: Live chat widgets, analytics trackers, heatmap recorders, and embedded video players decimate INP responsiveness. Defer third-party scripts until after main-thread hydration and initial user interaction.
- Server Caching & CDN Integration: Implement full-page caching and edge acceleration (such as Cloudflare) to deliver static assets from local Israeli POP edge caches.
- Unused CSS and JS Pruning: Heavy visual page builders load extensive styling frameworks sitewide. Implement conditional script loading and asset minification.
- Hero Background Video Removal on Mobile: Autoplaying background videos cripple mobile data connections and inflate LCP. Replace mobile video containers with optimized static poster images.
- Explicit Image & Container Dimensions: Prevent layout shifts (CLS) by assigning explicit width, height, and CSS aspect-ratio properties to all images, banners, and embed wrappers.
- Redirect Chain Elimination: Resolve multi-hop redirect chains (HTTP → HTTPS → www) to prevent latency overhead prior to document delivery.
If legacy proprietary platforms restrict access to low-level server headers and templates, explore our website platform selection guide to evaluate modern architectures.
What to Require from Developers Before Approving Speed Optimization
Website performance optimization is often sold with ambiguous deliverables. Before approving proposals, establish explicit contractual criteria:
- Documented Before-and-After CrUX Field Data: Demand validation based on real mobile user metrics rather than isolated desktop Lighthouse screenshots.
- Explicit Core Web Vitals Targets: Mobile LCP ≤ 2.5s, INP ≤ 200ms, and CLS ≤ 0.1.
- Multi-Template Audit Scope: Auditing across homepages, key service offerings, and high-traffic campaign landing pages.
- Staging Environment Testing: Ensure caching and script minification are tested in staging environments to prevent broken checkout flows and lead forms.
- 30-Day Follow-Up Verification: Validate sustained field data improvements once the 28-day CrUX window updates.
When repeated optimization cycles fail due to antiquated theme frameworks, review the 5 signs your website needs an upgrade to evaluate rebuilding on modern frameworks.
The Simple Web Approach
Simple Web is an AI-driven digital agency based in Bnei Brak, certified Meta Partners, and Google Ads specialists serving 200+ businesses with 28 verified 5★ Google reviews (discover more on our about page). Performance engineering is integrated into our baseline specification. Every custom business website we engineer launches with green Core Web Vitals, A+ speed scores, and modern Next.js static generation delivered in ~3 weeks (14 business days), including 6 months of complimentary SEO content (₪4,500 value).
For existing web assets, we offer complimentary discovery audits to explain real-world performance bottlenecks, alongside Simpi—our automated AI SEO agent. Simpi monitors technical performance, resolves broken links, optimizes sitemaps, and accelerates indexing on an ongoing subscription at ₪750 + VAT/month.
Conclusion
Executing a website speed audit takes moments, but understanding field metrics protects your marketing investment. Prioritize mobile CrUX field data over synthetic scores, measure against the three Core Web Vitals standards, and resolve foundational image, server, and third-party script bottlenecks. Ready to evaluate your website's performance metrics? Contact our team for a complimentary speed and technical audit.